

In this blog, we would like to share with you some insights about how attendance has increasingly become the business of Ofsted inspectors. Exploring data from almost 18,000 improvement needs identified in every inspection report published since September 2023, we hope to show school leaders how they can prioritise their work on attendance in order to improve outcomes.
Frequency of Attendance Need in Inspections
SSAT have been tracking the ‘need to improve’ comments in every inspection report about every education setting since September 2023. Attendance issues have been the sixth most frequent concern raised by inspection teams in that time. It is the only area for improvement in the top thirteen most common needs that is not about the quality of education.
And there are some interesting patterns emerging from the inspection report data over time. The first is that attendance concerns appeared much less frequently at the very end and start of the academic year (Q3 of the calendar year covers a smaller number of inspections carried out in the first half of July and the second half of September).
The increase in identified needs around attendance (the purple line in this chart) after Q4 of the 2023-24 academic year (from January to June) was striking. The frequency of comments about attendance almost doubled in that period, which reflected the rapidly growing concerns of the sector at this time. This period saw the creation of Attendance Hubs, the appointment of an Attendance Tzar, and the decision to make attendance guidance statutory from August 2024.
Linked to this last point, the back half of the 23-24 academic year also saw the inspectorate widening their interest in attendance beyond comments that it was not high enough and that schools needed to do more. We began to see comments specifically concerning the absence of vulnerable pupils (the disadvantaged and/or those with SEND) and an increased focus on how schools were using data on attendance to effectively target those with greatest need.
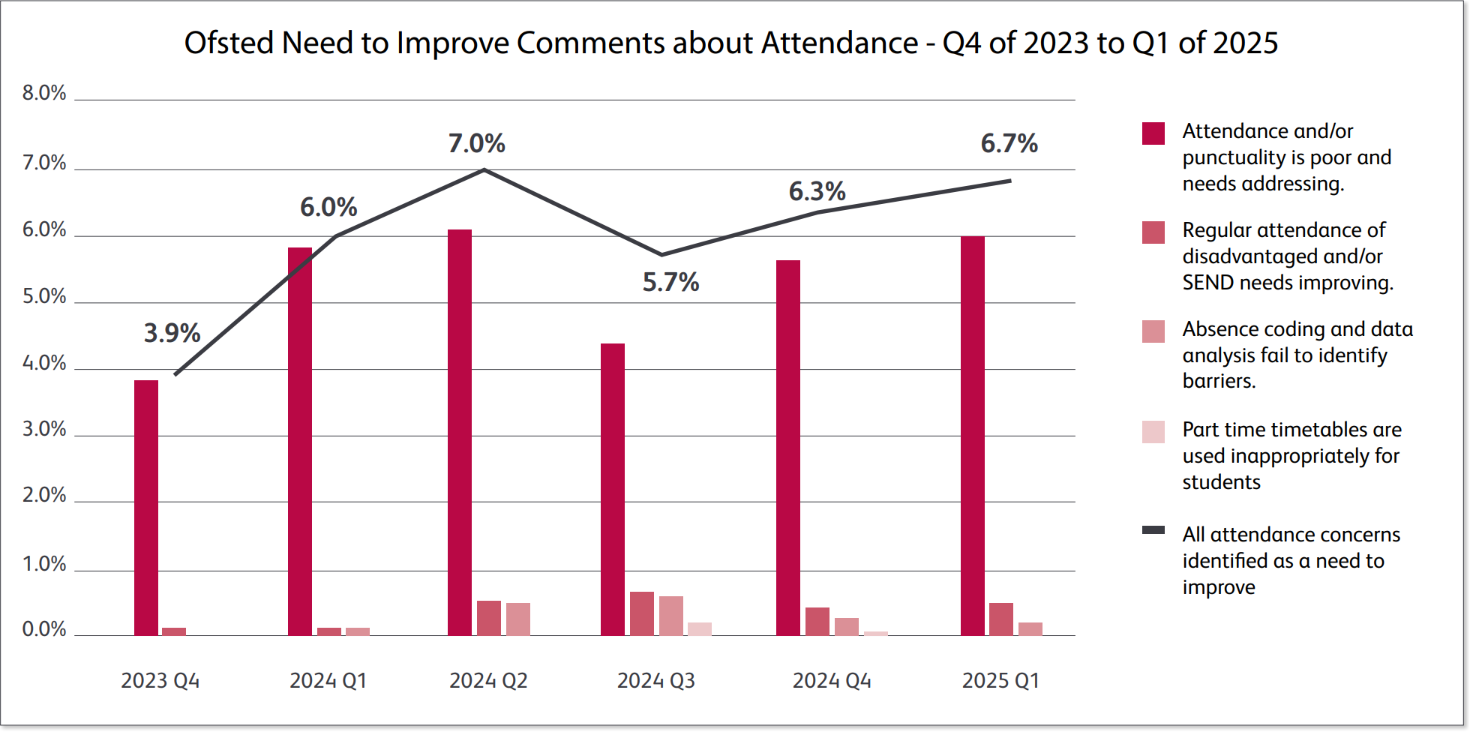
In the current academic year, we are seeing a similar trend in the data about attendance, with concerns becoming more pronounced as the year progresses. There are, though, two important differences. The first is that attendance concerns are starting from a higher base: in Q4 of 2024 attendance was mentioned 2.4% more frequently than in the same period of 2023. The second is that the trajectory of the frequency of attendance needs is flatter: in Q1 of 2025 (so far), attendance concerns are only 0.7% more frequent than in the same period of 2024.
Risk of Attendance Needs in Inspections
As well as looking at the frequency of need to improve comments in inspection reports, we can look at the relative risks of schools receiving a need comment around attendance. Our tracker has continued to identify an ‘indicative overall effectiveness grade’ for each inspection and correlated these with each need to identify the impact of that need on inspection outcomes.
We give indicative overall effectiveness grades largely based upon the grading for quality of education, except for any schools that have any inadequate judgment in their profile. This approach, carried forward from the previous inspection schedule, enables us to see (given that most inspections are still graded) the riskiest needs that schools should avoid.
Looking at the bottom two shaded lines of data, we can see that when attendance needs are identified in inspection reports, almost three-quarters of those schools go on to achieve an indicative good or outstanding grading for overall effectiveness. This figure is almost the same as for all needs, meaning that attendance concerns pose a similar risk to other needs.
For schools currently holding an outstanding grading, however, the identification of a need around attendance, is likely to carry less risk of losing that grade than other identified needs. The caveat is only about 1 in 20 schools with an attendance need are seen as outstanding, which means that any attendance need to improve is highly likely to prevent that school from demonstrating a profile which includes outstanding grades for their provision.
| Attendance Needs | Outstanding | Good | Requires Improvement | Inadequate | Risk of RI or Inadequate |
|---|---|---|---|---|---|
| Attendance and/or punctuality is poor and needs addressing | 6.1% | 69.2% | 19.9% | 4.9% | 24.7% |
| Regular attendance of disadvantaged and/or SEND needs improving | 7.8% | 70.6% | 15.7% | 5.9% | 21.6% |
| Absence coding and data analysis fail to identify barriers | 9.7% | 58.1% | 19.4% | 12.9% | 32.3% |
| Part time timetables are used inappropriately for students | 0.0% | 50.0% | 50.0% | 0.0% | 50.0% |
| All attendance needs | 6.3% | 68.8% | 19.7% | 5.2% | 24.9% |
| All improvement needs | 1.6% | 73.7% | 20.4% | 4.3% | 24.7% |
What is perhaps more interesting in this data is that different types of attendance need carry notably different levels of risk for inspection outcomes. Looking at the final column, we can see that the riskiest attendance needs (albeit representing only two schools so far) is around how part-time timetables are used against the expectations in statutory government guidance. Although this hasn’t been linked to an inadequate indicative grading yet, when mentioned in a report, it has been linked to a requires improvement indicative grading on 50% of cases.
The table shows that greatest risk of an indicative grading of inadequate for schools with absence identified as an improvement need is associated with a failure to identify barriers to attendance through effective use of data. More than one in eight schools with this as an identified need received inadequate gradings within their inspection grading profile.
Intriguingly, the least risky of the attendance needs featuring on inspections since September 2023 is around the attendance of pupils with SEND and/or in receipt of pupil premium funding. Almost four in five such schools were likely to be seen as being good or outstanding, and it is almost certain that this sadly reflects the particularly poor attendance rates of this group nationally and the lack of impact upon them through policy changes.
Another way of looking at inspection risk is about the relative change in gradings that come with specific needs. Using our methodology for indicative overall effectiveness against schools’ previous overall effectiveness grading, we can see what this looks like for attendance concerns.
| Attendance Needs | Improved | Static | Declined |
|---|---|---|---|
| Attendance and/or punctuality is poor and needs addressing | 17.9% | 65.3% | 16.8% |
| Regular attendance of disadvantaged and/or SEND needs improving | 15.7% | 66.7% | 17.6% |
| Absence coding and data analysis fail to identify barriers | 9.7% | 67.7% | 22.6% |
| Part time timetables are used inappropriately for students | 50.0% | 50.0% | 0.0% |
| All attendance needs | 17.5% | 65.4% | 17.0% |
| All improvement needs | 12.6% | 64.8% | 22.6% |
What this chart indicates is that schools with attendance needs mentioned in their report are more likely to retain or improve in relation to their previous inspection outcomes. Or, to put it another way, they are notably less likely to have a grading profile that shows a decline in the effectiveness of their provision than with other identified needs beyond attendance.
As mentioned above, the data for part-time timetable misuse are based on only two schools and so the lack of correlation with declining outcomes ought to be viewed cautiously. By far the riskiest attendance need for declining outcomes is around the use of data to identify barriers which, as described above, is the riskiest attendance need for an inadequate grading. The combination of these risks (or a low and a declining grading) means that data processes around monitoring and acting upon pupil absence ought to be a key consideration of school leaders generally and particularly for those with strategic responsibility for attendance.
Conclusions
Since January 2024, the rhetoric around pupil attendance has emphasised more than ever that it should become everyone’s business. This has certainly been true for inspection teams and they have been increasingly expecting this of schools. Not only has attendance become and remained one of the most frequent areas of focus on inspection, the range of identified needs has expanded to reflect the now statutory expectations of schools in tackling pupil absence.
Possibly the riskiest attendance need for schools is around the use of part-time timetables, but the data on this are too small at present to enable firm conclusions to be drawn. Although general attendance needs identified by inspection teams are not riskier than other identified needs, where schools are not gathering or using data effectively to identify and tackle the barriers to attendance, the risk of poor or declining outcomes is noticeably higher.
Pupil attendance is everyone’s business, including for all of us at SSAT
Using attendance data effectively to better target interventions
Thursday 13 March 2025, 16.00 – 17.30
If you are interested in finding out more about how our research suggests schools should be using data to effectively target interventions for students with attendance concerns, join us for our forthcoming webinar.
Attendance: Audit tool
SSAT also offers an evidence-informed audit tool for evaluation of your attendance work which aligns with the statutory attendance guidance. The tool itself, which is structured around the five ‘best bets’ for improving attendance identified by recent research, costs as little as £129 for SSAT members. We also offer the opportunity for schools to have their audits externally evaluated either by a desktop review or a school visit.
And finally, if you are unsure of what level of support for attendance would suit your school, feel free to book a call with our attendance expert and former headteacher, Dr Keven Bartle.